Table of Contents
This post may contain affiliate links. If you click a link and complete a purchase, we may earn a small commission at no extra cost to you.
Thanks to decades of climate education and awareness-building from the likes of Captain Planet to Greta Thunberg, we understand the threat climate change poses to our planet. It’s enough to make us want to live more intentionally and sustainability.
Sustainable travel is about exploring and celebrating the world while minimizing negative impacts on the environment.
And look, we’re not saying that individual responsibility will solve the climate crisis. Mitigating the effects of climate change will take commitments from corporations and governments on a global scale. However, understanding your personal carbon footprint (and how to reduce it) can be a meaningful way to embrace sustainability and adopt greener travel habits.
Your carbon footprint is the amount of greenhouse gas emissions, mainly carbon dioxide, released into the atmosphere through your actions. Carbon dioxide emissions result in global warming that melts ice caps, raises sea levels, and contributes to environmental destruction for ecosystems, wildlife, and agriculture that feeds our communities.
Even if you don’t rely on private jets for every commute — like some celebrities who like to travel Swift-ly 👀 — your travel habits can be a major contributor to your carbon footprint. That’s why France just banned short flights on routes where train service is available.
How much carbon emissions could you cut if you took the train instead of flying? We at Wanderu love ground travel already; it’s cheap, easy, and convenient. In this study, we’ll discover why buses & trains are also more sustainable than other travel modes. Read on to see how you can embrace your wanderlust while living your climate-responsible values.
Key Takeaways
- Intercity buses are the most sustainable mode of transportation in the U.S.
- Intercity buses are 550% more fuel efficient than cars are on a per-passenger basis.
- Taking the bus instead of flying can decrease your carbon footprint by up to 77.5%.
- Trains produce less CO2 emissions per-passenger than planes, and the average Amtrak train can carry more passengers than the average domestic jet plane.
What makes a travel mode more eco-friendly?
If you’re determined to reduce your carbon footprint, you should be aware of the direct effects that traveling has on the environment. There are a few factors that contribute to each mode of transportation’s impact. First off, there’s fuel efficiency, which determines how far a vehicle can travel on a gallon of fuel (or an equivalent amount of energy). This is important because energy in the form of gasoline, jet fuel, or electricity is carbon-intensive to produce.
The table below shows the average fuel efficiency for the four most popular ways that people travel – bus, train, car, and airplane — measured in passenger miles per gallon. This metric takes into account the number of passengers in a vehicle plus the vehicles’ fuel economy.
Fuel Efficiency
You can see that intercity buses are the most fuel-efficient option for travelers. Intercity buses are 550% more fuel efficient than cars are on a per-passenger basis.
Next, we checked out the average carbon dioxide emissions for each of these travel modes. The Congressional Budget Office has reported that transportation is the largest source of carbon dioxide emissions in the United States, and 83% of emissions in the transportation sector come from cars and trucks.
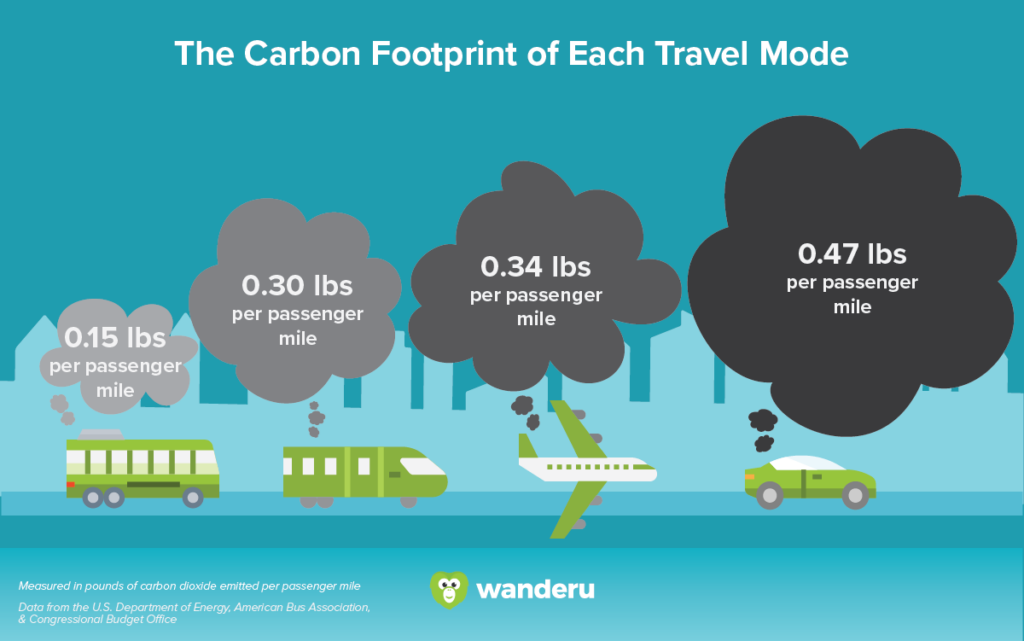
Opting for shared transportation modes, like buses and trains, can make a huge difference on the emissions released on each trip. The table below shows the average amount of carbon dioxide released per passenger mile.
Average CO2 Emissions
Passenger mile = one mile traveled by one passenger, as a unit of traffic
Driving releases almost half a pound of carbon dioxide for every passenger, every mile. This means even a 20-mile drive can release 10 pounds of carbon dioxide into the atmosphere. It would take one tree about six months to recapture the carbon dioxide released on this short drive.
It’s clear that traveling by bus or train is much more efficient and environmentally friendly than either driving or flying. In fact, traveling by bus rather than flying could decrease your carbon footprint by up to 77.5%.
Another extremely important thing to keep in mind about different types of transportation is their capacity.
Average Maximum Capacity of Vehicles
An average intercity bus can fit up to 55 people on board, while the average personal car can carry up to five passengers at a time. Unfortunately, it’s not very often that cars are filled to capacity. In fact, according to the Bureau of Transportation Statistics, the average car carries only between one and two passengers. Therefore, one bus can take as many as 55 cars off the road!
While trains might be a little less efficient than buses, their higher capacity makes the overall footprint of each train much lower than an airplane. The average Amtrak train can carry more people than the average domestic jet plane, compounding the positive effects of a lower per-passenger carbon footprint.
What is the most sustainable way to travel?
Here’s a quick overview of some of the most important stats we covered so far.
Based on this fuel efficiency and carbon dioxide emission data, the most sustainable mode of traveling in the U.S. is via intercity bus, followed by trains.
To help visualize just how big the difference is, check out this infographic illustrating the pounds of CO2 emitted per passenger mile when you travel by bus, train, plane, and car.
How would my carbon footprint differ on actual routes?
As we established above, choosing to travel by bus or train instead of flying or driving can significantly reduce your personal impact on the environment. While you will probably still opt to fly if you’re going somewhere really far, you should definitely consider ground transportation for short-distance trips and spare our planet the extra fuel exhausts.
Not only will Mother Nature appreciate it, but your bank account will be happy as well, since bus and train travel is usually just a fraction of the cost of flying or driving.
To demonstrate just how big of a difference ground travel can make, we picked five popular short-distance routes from across the country and calculated what the carbon footprint of one traveler would be if they traveled by bus, train, car, or airplane.
New York City to Boston
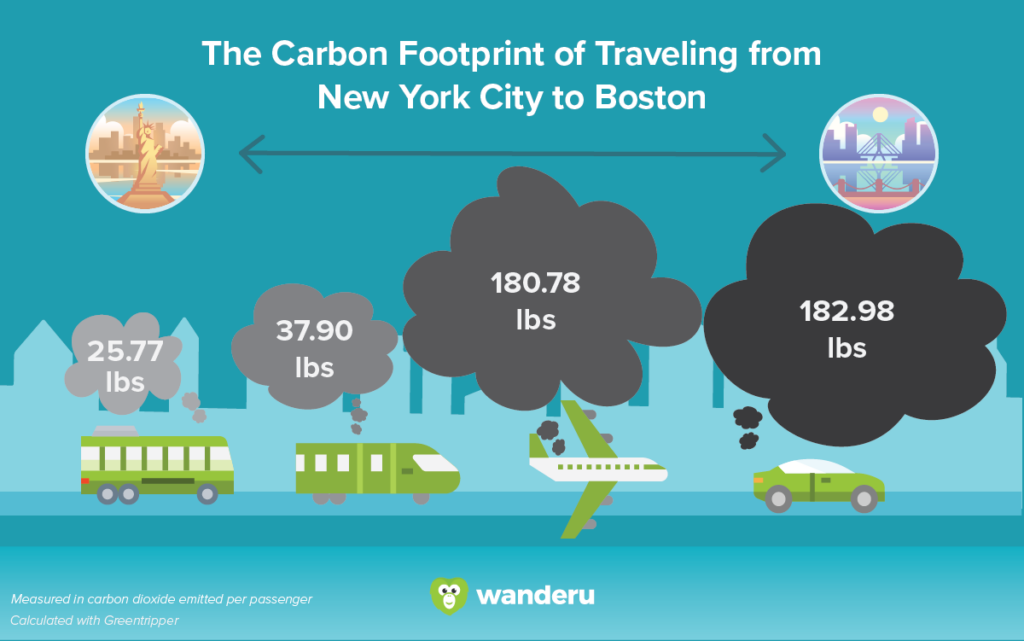
Taking a bus from New York to Boston is the most sustainable way to travel between the two biggest cities in the Northeast.
While flying will get you there in about 45 minutes, it can be 7 times more harmful to the environment than taking the bus. In fact, it could take one tree more than eight years to offset the amount of CO2 released from your brief flight from NYC to Boston.
Driving between New York City and Boston is actually the most carbon-intensive option for a single passenger. You can significantly reduce your personal emissions by opting for the bus or train instead.
New York City to Philadelphia
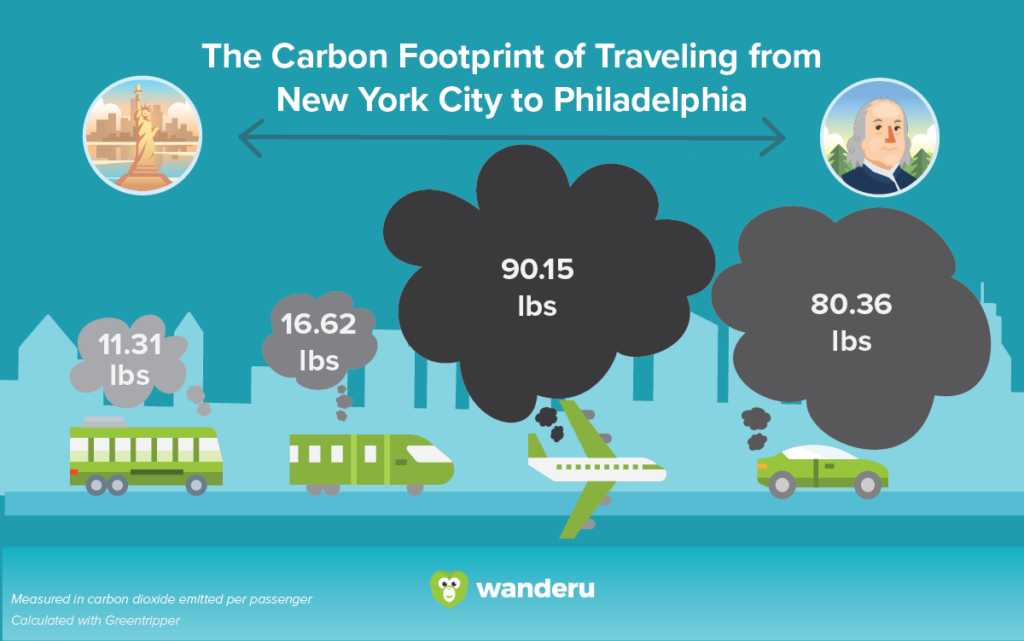
When you take the bus from New York to Philadelphia, you are reducing your carbon footprint by more than 7 times compared to driving.
Besides, with an average bus fare of around $15, leaving your car at home is a no-brainer. It will make you not only a conscious environmentalist but also a financially responsible adult!
San Diego to Los Angeles
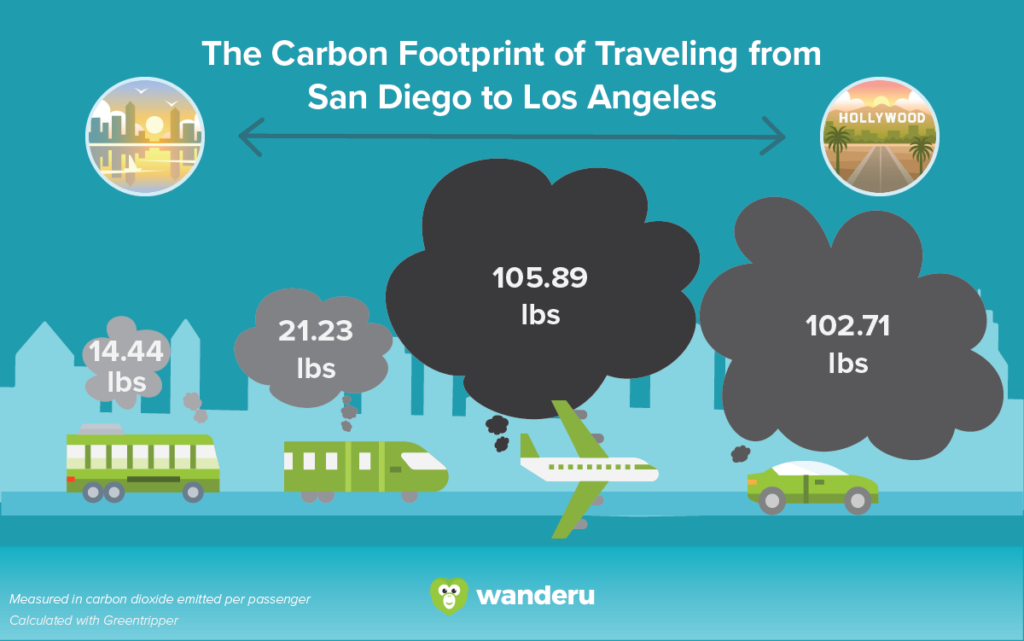
Driving from San Diego to Los Angeles is nearly 5 times more harmful than taking the train on the same route.
Hopping on a bus or a train from San Diego to Los Angeles is not only eco-friendly but also a smart decision when it comes to transportation. Traffic in Southern California is notoriously hairy and we’ll embrace every opportunity there is to reduce the number of vehicles on the road.
If enough people take the bus or the train instead of driving, that would get hundreds of cars off the road, easing traffic and significantly reducing harmful carbon dioxide emissions – it’s a win-win for everyone!
Los Angeles to Las Vegas
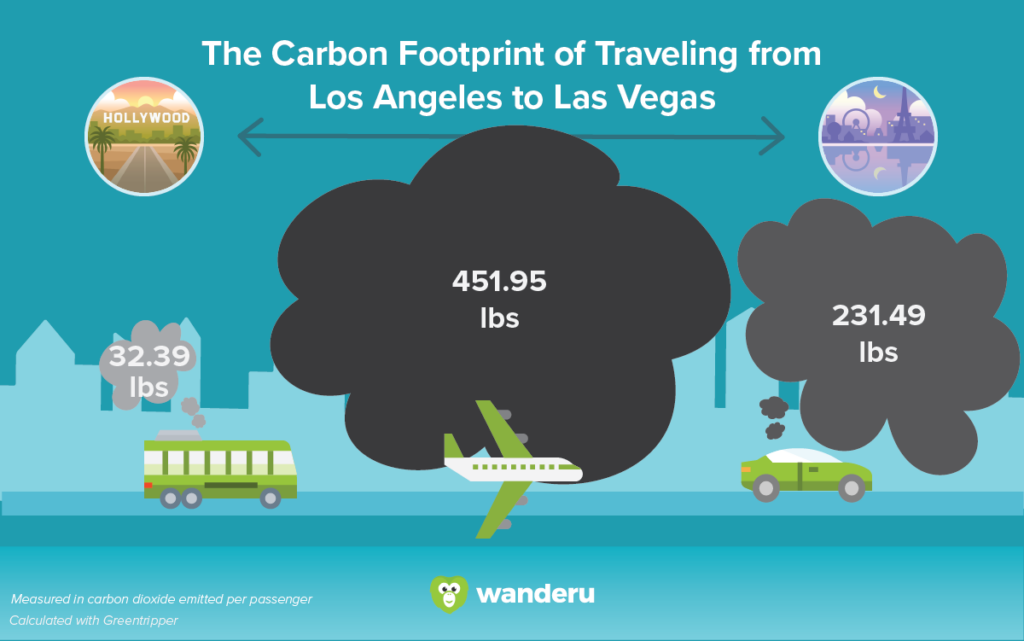
There is no train service between Los Angeles and Las Vegas, so the only eco-friendly option is to take a bus from Los Angeles to Las Vegas. The flight from L.A. to Vegas would emit over 450 pounds of carbon dioxide into the atmosphere — it would take one tree over 20 years to absorb that amount of harmful greenhouse gas.
Even though it makes for a longer journey than flying, taking a bus between L.A. and Vegas is 14 times better for the environment. Plus, it’s definitely cheaper, which means you will have more money to spend on all the fun that Sin City has to offer.
Boston to Providence
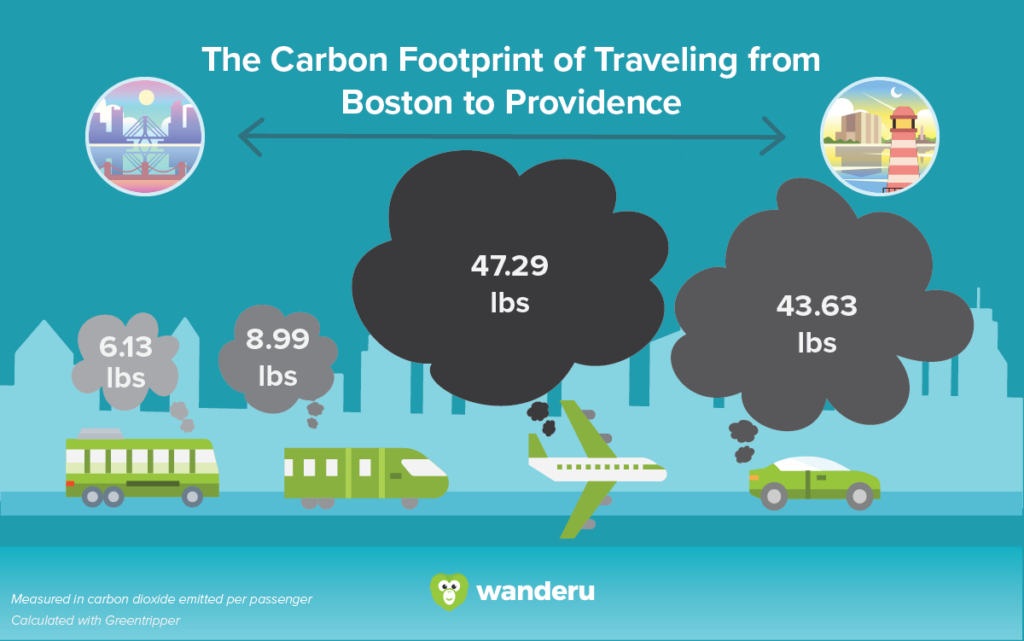
As you probably can guess, traveling from Boston to Providence by bus is the most sustainable option. Your trip’s carbon footprint could be 7 times larger if you drive there instead. Even if you take an Amtrak train, you will still be a lot more eco-friendly compared to driving or flying. Besides, for just a 40-minute trip, there’s really no need to fly.
How can I reduce my carbon footprint?
Your travel habits and preferences are among the key elements that dictate your carbon footprint. In fact, you can drastically reduce (or increase) the amount of carbon dioxide emissions you’re responsible for by choosing a particular form of transportation over another.
As we’ve discovered, bus and train travel are your best bets for trips you can feel good about. Turn to Wanderu to find all the best bus and train options in one place, and you’ll soon find out just how easy it is to travel more sustainably.
In addition to reducing your carbon footprint, you can also actively help offset the amount of carbon dioxide you do end up releasing into the atmosphere through your travels. CarbonFund.org has a wonderful initiative that allows you to contribute donations that go directly to planting trees across the globe. For just $1 per tree, you can help reduce climate change, improve air quality, and preserve biodiversity, among many other things.
While it would be naive to think that you can completely stop all activities and habits that affect your carbon footprint, there are many ways that you can consciously reduce it to a minimum. Yes, it might require you to make a few adjustments to your lifestyle here and there but, at the end of the day, you are prolonging the life of our planet and contributing to the continuous well-being of everyone who shares its resources. After all, is there anything more important than that?
Methodology
- Fuel economy stats are sourced from The U.S. Department of Energy & the American Bus Association.
- Carbon dioxide emission stats are sourced from the Congressional Budget Office.
- Capacity stats sourced from Greyhound (maximum capacity of average bus), Amtrak (train sizes & capacity vary in different regions), True Cost (car capacity), & Ponder Weasel (average capacity of Airbus A320 & Boeing 727)
- To calculate the carbon dioxide emissions for specific routes, we used Greentripper’s CO2 calculator and converted the emissions to pounds.
- Car stats are based on the fuel efficiency of gas-powered (non-hybrid) mid-sized cars.
- Flights are for economy seating & direct flights.
- To determine how long it would take for trees to recapture certain amounts of emissions, we used data from One Tree Planted, indicating that the average tree absorbs about 22 pounds of carbon dioxide per year for its first 20 years of growth.
You are welcome to use the information and graphics on this page, crediting Wanderu. If you do so, please link back to this page, so that eco-conscious travelers around the world can see all the data and find out how we did this study.